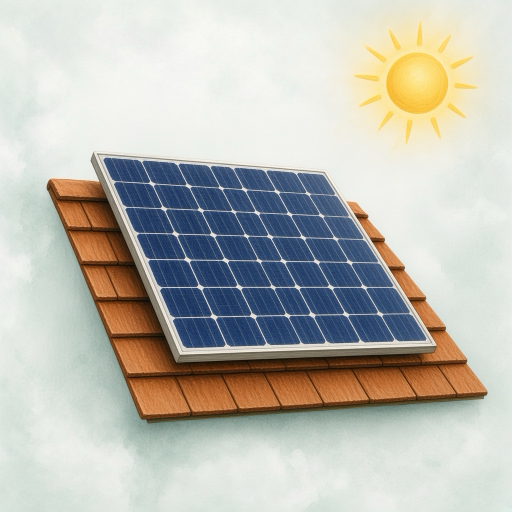
A solar panel turns sunlight directly into electricity. It has no moving parts at all: nothing spins, nothing burns, and it makes no noise. Light lands on the panel, knocks tiny particles called electrons loose inside it, and those moving electrons are electricity. That is why a panel can sit on a roof for twenty-five years with almost nothing done to it.
Why solar panels are surprising
Most ways of making electricity are basically the same idea: heat something up, boil water, use the steam to spin a big magnet. Coal plants do that. Gas plants do that. Nuclear plants do that too.
A solar panel skips all of it. There is no fire, no water, no steam, and no spinning. Light goes in and electricity comes out.
Here is the second surprise. Panels need light, not heat, and they actually work a little better when they are cool. A cold, bright winter day can produce more electricity than a blazing hot one. Germany, which is famously cloudy and not very warm, was a world leader in solar for years.
Key facts about solar power
A solar panel makes electricity from light, with no moving parts.
The effect was discovered in 1839 by Edmond Becquerel, a French scientist who was 19 years old.
The first useful solar cell was built in 1954 at Bell Labs in New Jersey.
That first cell turned about 6 percent of sunlight into electricity. Panels today manage more than 22 percent.
Panels are mostly silicon, which comes from sand. Silicon is one of the most common materials on Earth.
The first solar-powered satellite, Vanguard 1, launched in March 1958. It is still up there, the oldest human-made object in orbit.
Solar panels cost more than 99 percent less today than they did in the 1970s.
Sunlight arrives at the top of our atmosphere at about 1,361 watts per square meter.
The sunlight Earth absorbs in about an hour and a half carries more energy than everybody on the planet uses in a year.
Solar is now one of the cheapest ways to make new electricity.
The satellite that is still there
In March 1958, the United States launched a satellite called Vanguard 1. It was tiny, about the size of a grapefruit, weighing roughly 3 pounds (1.5 kg). It carried solar cells, the first spacecraft ever to run on sunlight.
Its radio stopped working in 1964. But the satellite itself never came down. It is still circling Earth right now, more than sixty-five years later, and it is the oldest human-made object in orbit. Scientists expect it to keep going for centuries.
Solar cells were far too expensive for houses back then. Space was the one place where price did not matter much, because you cannot run an extension cord to orbit.
Common myths about solar power
Myth: Solar panels only work in hot deserts.
Panels need light, not heat. They work in cold places, and heat actually lowers their output a little.
Myth: Panels stop completely when a cloud passes.
Output drops, but it does not stop. Clouds scatter light rather than blocking all of it.
Myth: Panels make electricity at night.
They do not. Anything you use after dark comes from a battery or from the grid.
Myth: Solar panels are made from something rare.
They are mostly silicon, which comes from sand, plus glass and aluminum. The hard part is cleaning the silicon, not finding it.
Frequently asked questions about solar power
How does a solar panel work?
Sunlight knocks electrons loose inside the silicon, and a built-in electrical push inside the panel makes them all flow the same way. That flow is electricity.
Who invented the solar cell?
Edmond Becquerel found the effect in 1839. The first practical cell was made in 1954 by Daryl Chapin, Calvin Fuller, and Gerald Pearson at Bell Labs.
Do solar panels work on cloudy days?
Yes, just less. They also work in winter, and cold weather is slightly helpful.
What happens at night?
Nothing. A panel produces power only when light is falling on it, so batteries or the grid cover the dark hours.
How long do solar panels last?
Usually 25 to 30 years or more. They slowly get a little weaker, about half a percent per year, rather than suddenly stopping.
Why are solar panels on satellites?
Sunlight in space is stronger because no atmosphere absorbs any of it, and a panel keeps working for decades without fuel. A few spacecraft have used nuclear batteries or fuel cells instead, but almost everything in orbit runs on solar panels.
Solar power means converting energy from sunlight into electricity. The most common method uses photovoltaic panels, which turn light straight into electric current with no moving parts, no fuel, and no water. A second, much rarer method uses fields of mirrors to focus sunlight, make heat, and drive a steam turbine. Solar is now among the cheapest sources of new electricity in most large countries, which was not true twenty years ago.
A discovery that waited 115 years
In 1839, a 19-year-old named Edmond Becquerel was experimenting in his father’s laboratory in Paris. He put metal electrodes into a chemical solution, shone light on them, and measured an electric current. He had found the photovoltaic effect, the principle behind every solar panel on Earth.
Then almost nothing happened for over a century. Selenium cells built in the 1880s converted about 1 percent of the light hitting them, which is far too little to be useful for anything.
The breakthrough came in April 1954, when Daryl Chapin, Calvin Fuller, and Gerald Pearson at Bell Labs in New Jersey built a silicon cell that reached about 6 percent. That was roughly six times better than the selenium cells that came before it. The New York Times reported the announcement and forecast that solar cells would eventually deliver the limitless energy of the Sun. It attached no date, and cells stayed far too expensive for houses for about fifty more years.
Why solar cells are not 100 percent efficient
A typical panel converts about 23 percent of the light landing on it. That sounds disappointing until you understand why the number cannot be much higher.
Light arrives as particles called photons, carrying different amounts of energy. Silicon needs a certain minimum energy to knock an electron loose. Photons carrying less than that pass straight through and do nothing at all. Photons carrying more knock an electron loose and then waste all their extra energy as heat.
Between those two losses, physics sets a hard ceiling of about 33 percent for an ordinary single-layer cell. Two scientists, William Shockley and Hans-Joachim Queisser, calculated it in 1961. No amount of careful manufacturing gets past it.
Engineers do get past it, but only by changing the rules: stacking layers that each capture a different part of the spectrum. Cells built that way have exceeded 47 percent under concentrated light.
Why solar got so cheap
Solar panels cost more than 99 percent less than they did in the 1970s. Almost nothing else in modern manufacturing has fallen that far.
The pattern has a name: Swanson’s law, after Richard Swanson, who founded the panel maker SunPower. Every time the world’s total production of panels has doubled, the price has dropped by roughly 20 percent. This is not a law of physics. It is what happens when factories get bigger, workers get more practiced, and small improvements accumulate across millions of units.
The result flipped solar from the most expensive way to make electricity to one of the cheapest. In 2020 the International Energy Agency described solar as the cheapest source of electricity in history in many markets.
Key facts about solar power
Edmond Becquerel discovered the photovoltaic effect in 1839, aged 19.
The first practical silicon solar cell was built at Bell Labs in April 1954, at about 6 percent efficiency.
Panels sold today convert roughly 19 to 25 percent of incoming light, averaging about 23 percent.
Physics limits an ordinary single-layer cell to about 33 percent.
Stacked multi-layer cells have exceeded 47 percent under concentrated sunlight.
Module prices have fallen by more than 99 percent since the 1970s.
China manufactures roughly 80 percent or more of the world’s panels at every stage of production.
Global installed solar capacity passed 2 terawatts during 2024.
Panels lose about half a percent of output per year, and mainstream modules now carry 30-year power warranties.
Solar panels produce direct current, so an inverter converts it for the grid.
The duck-shaped problem
Solar creates a scheduling problem that has nothing to do with the panels themselves.
Draw a graph of how much electricity a grid needs from everything other than solar, hour by hour, across a sunny day. In the middle of the day solar covers a lot of it, so the line sags. Then the Sun sets, people come home, turn on lights, ovens, and air conditioning, and the line shoots up steeply.
Grid operators looked at that shape and named it the duck curve, because the sag and the steep neck look like a duck.
The hard part is not the total amount of electricity. It is the speed of that evening climb, when other power plants must ramp up quickly as solar fades. Batteries, long transmission lines that reach places where the Sun is still up, and shifting demand into the daytime are the standard answers, and all three are being built now.
Common myths about solar power
Myth: Panels do not work in cold or cloudy places.
Cold helps slightly, and clouds reduce output without eliminating it. Cloudy countries have run large solar programs successfully.
Myth: Making a panel uses more energy than it ever produces.
A modern utility-scale system repays its manufacturing energy in roughly a year, against a service life of 25 to 30 years.
Myth: Solar panels stop working after about ten years.
They decline gradually, about half a percent a year, and mainstream modules are now warranted to still produce about 87 percent of rated output after 30 years.
Myth: All solar power plants use mirrors.
The overwhelming majority use flat photovoltaic panels. Mirror plants are a small niche that has largely lost the cost race.
Frequently asked questions about solar power
Why are panels only a little over 20 percent efficient?
Light too weak to free an electron passes through, and light with extra energy wastes the surplus as heat. Those two losses cap a single-layer cell near 33 percent, and manufacturing realities bring a typical module to about 23.
Why did panels get so cheap?
Manufacturing scale. Each doubling of total production has cut prices by roughly a fifth, and the world has doubled production many times over.
Where are solar panels made?
Mostly in China, which holds roughly 80 percent or more of capacity across the whole supply chain.
What is an inverter?
The box that converts the direct current from the panels into the alternating current the grid uses. It is usually the first part of a system to need replacing.
Do solar farms produce their rated power all day?
No. The rating describes full sunlight. Averaged over a year, output is closer to a fifth or a quarter of that.
What happens to old panels?
Frames and glass are recycled readily. Recovering the silicon and silver costs more than the materials are worth, and most retired panels in the United States still go to landfill.
Solar power converts energy from sunlight into electricity, overwhelmingly through photovoltaic cells that produce current directly from absorbed light. Global installed capacity passed 2 terawatts during 2024, after taking 68 years to reach the first terawatt and only 2 years to add the second. The technology’s defining characteristic is not its efficiency, which is modest, but its cost trajectory: module prices have fallen by more than 99 percent since the 1970s, which converted solar from a space-program curiosity into the cheapest source of new electricity in most large markets.
What actually happens inside a cell
A photovoltaic cell is a silicon wafer with two differently doped regions. One is treated to have surplus electrons, the other surplus vacancies, and the junction between them develops a built-in electric field.
Absorbed light frees electrons throughout the material. Without the junction they would wander and recombine, producing heat and nothing else. The internal field gives them a direction, so they flow consistently toward one contact, through whatever circuit is connected, and back to the other side. That directed flow is the current.
Two consequences follow that people often find counterintuitive. Heat reduces output, because higher temperature increases recombination and lowers the voltage the cell can sustain; a cold bright day beats a hot one. And the cell responds to light, not warmth, so diffuse light on an overcast day still produces meaningful current.
Why about 22 percent, and why that is fine
The ceiling on a single-junction cell comes from the spectrum, not from workmanship. Silicon requires roughly 1.1 electron volts to free an electron. Photons below that threshold pass through unabsorbed. Photons above it free an electron and dump the surplus energy as heat within picoseconds.
Shockley and Queisser worked out in 1961 that these two losses, plus unavoidable radiative recombination, cap a single-junction cell near 33 percent, with the optimum band gap around 1.34 electron volts. Silicon at 1.1 sits slightly below that optimum. Commercial modules span roughly 19 to 25 percent, with a shipment-weighted average of 22.7 percent, and record laboratory silicon cells sit in the high 20s.
The way past the ceiling is to stop using one band gap. Stacking a wide-gap absorber above silicon lets each layer work on the part of the spectrum it handles best. Perovskite-silicon tandems have exceeded 34 percent in certified laboratory measurements, and multi-junction concentrator cells have passed 47 percent under focused light.
Perovskite’s obstacle is durability rather than efficiency. The material degrades under moisture, oxygen, heat, ultraviolet exposure, and reverse bias, and mixed-halide compositions can separate into distinct phases under illumination. Silicon modules run outdoors for thirty years; perovskite has not yet demonstrated anything close.
Key facts
Edmond Becquerel discovered the photovoltaic effect in 1839; the first practical silicon cell came from Bell Labs in 1954 at about 6 percent.
Vanguard 1, launched March 1958, was the first solar-powered satellite and remains the oldest human-made object in orbit.
Single-junction cells are capped near 33 percent; commercial modules span roughly 19 to 25 percent and average 22.7 percent by shipment.
Perovskite-silicon tandems exceeded 34 percent in certified laboratory results in 2025.
Module prices fall roughly 20 percent per doubling of cumulative production, an experience curve known as Swanson’s law.
A modern US utility-scale system repays its manufacturing energy in roughly 0.5 to 1.2 years, against a 25 to 30 year life.
Modules degrade about 0.5 percent per year, and mainstream n-type modules now carry 30-year linear warranties ending near 87 percent of rated output.
China holds roughly 80 percent or more of manufacturing capacity across the whole supply chain.
Global capacity passed 2 terawatts during 2024, two years after passing the first terawatt.
Panels produce direct current; inverters convert it and are usually the first major component replaced.
Cost, and the part that gets misread
The price decline is the central fact of modern solar, and it is regularly misunderstood as a technology story. Efficiency has improved from about 15 to about 22 percent for commercial modules over two decades, which is real but modest. Price fell by well over 90 percent in the same period.
The gap between those two numbers is manufacturing: larger factories, better yields, thinner wafers, less silicon wasted as saw kerf, cheaper polysilicon, and accumulated process knowledge. Swanson’s law captures the pattern as roughly 20 percent price reduction per doubling of cumulative volume, which is an experience curve of the kind documented across many manufactured goods since the 1930s.
Two cautions follow. First, the relationship is tied to doublings of cumulative production rather than to calendar time, so the pace of annual price declines depends on how fast deployment keeps growing. Second, module price is now a minority of the cost of an installed system; land, mounting, wiring, inverters, labor, permitting, and grid connection dominate, and those have not fallen at anything like the same rate.
Integration is the current problem
Once solar is cheap, the difficulty moves from generation to timing.
Solar output peaks near midday. Household demand peaks in the early evening. Plot net demand across a sunny day on a high-solar grid and the curve sags at midday and climbs steeply at dusk, a shape operators named the duck curve. The steep evening ramp is the engineering problem, because other plants must increase output quickly as solar fades.
Two further effects appear at high penetration. Curtailment: when midday generation exceeds demand plus available storage and transmission, some output is discarded, and wholesale prices occasionally go negative. And value deflation: because each additional solar plant produces at the same hours as all the others, the market value of marginal solar output falls as its share rises.
This is why levelized cost of electricity, which divides lifetime cost by lifetime output, understates the system cost of solar. It treats a midday kilowatt-hour as identical to an evening one. Storage, transmission, and demand flexibility are therefore not optional extras but part of what solar costs at scale.
Space, land, and the footprint question
Solar’s land requirement is raised often and usually framed badly. A utility-scale plant occupies roughly 5 to 10 acres per megawatt of capacity (2 to 4 hectares) depending on technology, spacing, and whether trackers are used, which is more land per unit of energy than a thermal plant’s site but far less than the land supporting that plant’s fuel supply.
The more useful framing is what the land is doing otherwise. Rooftops, parking canopies, reservoirs, and land alongside transport corridors carry no competing use worth much, and deployment there avoids the question entirely. Agrivoltaics, where panels are mounted high enough for crops or grazing underneath, keeps agricultural output while generating, and in hot climates partial shade can improve yields for some crops.
The genuine constraint is more often interconnection than acreage. Queues for grid connection now run years in many markets, and a project’s schedule is frequently set by transmission capacity rather than by land, permits, or equipment.
Common misconceptions
“Panels need heat.” They need light. Higher temperature reduces output.
“Making a panel uses more energy than it produces.” Modern utility systems repay manufacturing energy in around a year and operate for decades.
“Efficiency is what matters.” Cost per watt has driven deployment far more than efficiency. A cheaper 20 percent module beats a costly 26 percent one in most applications where space is not the binding constraint.
“Solar panels stop working after their warranty.” They degrade about half a percent a year. The warranty guarantees a performance floor, not an expiry date.
“Cheap solar solves the electricity problem.” It solves generation cost. Timing, storage, and transmission are separate problems that get harder as solar share rises.
Frequently asked questions
Why does heat reduce panel output?
Higher temperature increases carrier recombination and lowers the cell’s voltage, so the same light produces less power.
How do tandem cells beat the single-junction limit?
Each layer has a different band gap and converts a different part of the spectrum efficiently, so less energy is lost to transmission and thermalization.
Why is perovskite not in commercial modules yet?
Stability. It degrades under moisture, heat, ultraviolet exposure, and reverse bias on timescales far shorter than the decades silicon delivers.
What is curtailment?
Deliberately discarding available generation when supply exceeds what the grid can use or move. It signals that storage and transmission lag generation.
Why is levelized cost a misleading comparison?
It ignores when energy is produced. On a high-solar grid, midday energy is worth less than evening energy, and levelized cost prices them the same.
Are old panels recyclable?
Frames and glass are recovered readily and account for most recoverable value. Silicon and silver recovery usually costs more than the material is worth, and most retired US panels still go to landfill.
Photovoltaic conversion is bounded from above by thermodynamics and from below by manufacturing cost, and the interesting engineering lives in the gap between them. Understanding solar at a technical level means holding two distinct accounts at once: a physics account of where incoming energy goes inside a cell, and an economic account of where dollars go across a system’s life. Neither predicts deployment on its own, and the second has driven the last two decades far more than the first.
Detailed balance and where the energy goes
Shockley and Queisser’s 1961 derivation treats a cell as a body in radiative equilibrium, absorbing the solar spectrum and emitting according to its temperature and band gap. The bound follows without reference to any material’s manufacturing quality.
Two loss terms dominate. Sub-band-gap transmission: photons with energy below the gap are not absorbed at all, and for silicon at roughly 1.1 electron volts this is a substantial fraction of the infrared spectrum. Thermalization: photons above the gap create carriers with excess kinetic energy that dissipates as lattice heat within picoseconds, so a blue photon and a red photon above threshold deliver the same usable energy. Radiative recombination and the entropy of a finite acceptance angle account for the remainder.
The optimum single-junction band gap under the terrestrial spectrum falls near 1.34 electron volts, giving 33.16 percent. Silicon’s 1.1 places it slightly below optimum, costing about a point of ceiling and delivering, in exchange, seventy years of semiconductor process knowledge and effectively unlimited feedstock.
Concentration raises the bound by increasing the incident photon flux relative to the emitted flux, which is the thermodynamic reason concentrator cells achieve higher efficiencies than the same junctions under one sun.
Tandems and the current-matching constraint
Splitting the spectrum across multiple band gaps addresses both dominant losses at once. A wide-gap top cell converts high-energy photons with less thermalization; a narrow-gap bottom cell captures what passes through.
The architecture imposes its own constraint. In a two-terminal tandem the junctions are in series, so the same current flows through both and the lower-current junction limits the device. Band gaps and layer thicknesses must therefore be chosen so the junctions generate comparable current under the design spectrum.
That design spectrum is a fiction the rest of the time. Solar spectral content shifts with air mass, cloud cover, humidity, and season, so a tandem matched at standard test conditions is mismatched through much of a real year. This is why annual energy yield and peak certified efficiency diverge for tandems more than for single junctions, and why four-terminal architectures, which extract from each junction independently, remain of interest despite their additional wiring, optical losses, and power electronics.
Passivation as the driver of cell architecture
Modern silicon cell development is largely a story about surface recombination. Carriers freed in the bulk are lost if they recombine before reaching a contact, and unpassivated surfaces and metal contacts are where that happens most readily.
PERC added a dielectric passivating layer to the rear with local openings for contact. TOPCon interposes a thin tunneling oxide beneath a doped polysilicon layer, passivating the surface while remaining conductive, which reduces contact recombination without sacrificing collection. Heterojunction cells use thin intrinsic amorphous silicon films for passivation, achieving very high open-circuit voltages at the cost of a low-temperature process incompatible with some standard metallization.
Each generation buys on the order of a percentage point in efficiency and tens of millivolts in open-circuit voltage: the shipment-weighted average module efficiency rose from 21.6 percent to 22.7 percent in a single year as n-type cells displaced p-type. TOPCon displaced PERC in new manufacturing capacity, with heterojunction taking a growing share, and the choice increasingly interacts with tandem plans because the bottom cell’s surface must survive perovskite deposition.
Where the silicon actually goes
Polysilicon purification is the energy-intensive step, typically depositing silicon from a gas onto heated rods to reach purity far beyond metallurgical grade. That purified material is grown into ingots and sliced into wafers, and every cut consumes an additional slab of silicon alongside the roughly 140-micrometer wafer it yields.
Kerf loss therefore discards material that has already absorbed the expensive purification energy. The industry’s response has been sustained on two fronts: diamond wire sawing, which cuts a narrower kerf than older slurry methods, and progressive wafer thinning. Neither improves cell efficiency at all. Both reduce cost per watt, which is what actually determines deployment.
This is the general shape of photovoltaic progress. Most of the cost reduction has come from process and scale rather than from device physics, which is why the price curve and the efficiency curve have such different slopes.
System design past the module
At system level the module is no longer the dominant cost, and several design choices look wrong until the economics are stated.
Arrays are routinely oversized relative to inverter capacity. Because full output occurs for few hours per year, a DC to AC ratio well above one raises production across the many hours of partial sun while sacrificing a small amount of clipped energy at midday peaks. Clipping is an intentional tradeoff, not a fault.
Trackers add cost and maintenance and buy a materially flatter production profile, which is worth more on a grid where midday energy is already abundant. Bifacial modules collect ground-reflected light on the rear face, with gain that depends directly on what lies beneath: snow and light gravel deliver far more than dark soil.
Inverters, not modules, are usually the first major replacement, typically at 10 to 15 years against a module life of 25 to 30.
The economics of abundance
Levelized cost of electricity divides lifetime cost by lifetime generation. It is a useful comparison only where timing and location are irrelevant, and on a high-solar grid they are the whole problem.
Solar output is strongly correlated across an entire region, so every plant produces at the same hours. As penetration rises, marginal output arrives when the market is already well supplied, and its value falls. This is value deflation, and it is distinct from the cost of building the plant, which has continued to decline. Curtailment and negative wholesale prices are the visible symptoms.
The implication is structural. Storage, transmission, and demand shifting are not accessories to cheap solar; they are the mechanism by which cheap solar retains value at scale. An analysis that compares solar’s levelized cost against a dispatchable source’s levelized cost and stops there has omitted the part that determines the answer.
Similarly, Swanson’s law is an experience curve fitted to cumulative production, not a physical guarantee, and it says nothing about calendar time. The annual rate of price decline depends on how quickly cumulative volume doubles, and deployment has so far held close to a constant exponential rate, doubling roughly every three years. Projecting historical annual percentage declines forward therefore assumes that growth rate continues, which is a separate and weaker claim than the learning curve itself.
Ratings are measured under conditions that never occur
Module nameplate ratings are established at standard test conditions: an irradiance of 1,000 watts per square meter, a cell temperature of 77 °F (25 °C), and a defined reference spectrum corresponding to sunlight passing through 1.5 atmospheres. The combination is convenient for comparing products and almost never occurs in the field.
The temperature term is the one that bites. A cell reaching 1,000 watts per square meter of irradiance is absorbing energy and warming well past 77 °F (25 °C), typically to 113 °F (45 °C) or higher in still air. Because output falls with temperature, a module rated at its nameplate under test conditions delivers meaningfully less at the moment irradiance is highest. Manufacturers publish a temperature coefficient for exactly this reason, and system designers apply it rather than the nameplate when estimating real production.
Spectrum is the subtler term. The reference spectrum fixes one air mass and one atmospheric composition, while actual spectral content shifts with sun angle, humidity, and aerosols through the day and year. Single-junction silicon is fairly tolerant of that drift. Tandems are not, because current matching depends on the ratio of photons above and below the top cell’s gap, which is precisely what shifts.
The practical consequence is that certified efficiency and delivered annual energy are different quantities, and comparisons between technologies made on the first can invert when made on the second.
Key facts
The single-junction bound follows from detailed balance, dominated by sub-band-gap transmission and thermalization.
Optimum single-junction band gap is near 1.34 electron volts, giving 33.16 percent; silicon sits at roughly 1.1.
Two-terminal tandems are series-connected, so current matching under a shifting spectrum constrains real-world yield.
PERC, TOPCon, and heterojunction architectures target surface and contact recombination.
Kerf loss discards already-purified silicon, which is why diamond wire sawing and wafer thinning matter economically.
DC to AC ratios above one are standard, with clipping accepted as an economic tradeoff.
Value deflation lowers the market value of marginal solar as penetration rises, independently of construction cost.
Swanson’s law is an experience curve tied to doublings of cumulative volume, not a fixed annual rate.
Common misconceptions at expert level
“Higher efficiency is the objective.” Cost per watt and cost per unit of delivered value dominate. Efficiency matters most where area is constrained.
“Concentration cheats thermodynamics.” It raises the bound legitimately, by increasing incident flux relative to emission. The detailed balance framework accommodates it.
“Tandem records translate to field yield.” Records are single-spectrum, small-area, laboratory measurements. Spectral drift, area scaling, and stability all intervene.
“Curtailment means overbuilding was a mistake.” Some curtailment is economically optimal, since sizing generation for the rarest conditions is more expensive than discarding occasional surplus.
“Module price drives installed cost.” Modules are now a minority of installed system cost in most markets.
Frequently asked questions
Why does the optimum band gap sit near 1.34 electron volts?
It balances two opposing losses: a lower gap absorbs more photons but wastes more energy per photon to thermalization, while a higher gap extracts more per photon but transmits more of the spectrum unused.
Why is current matching only a two-terminal problem?
Series connection forces a common current. Four-terminal designs extract from each junction independently and avoid the constraint, at the cost of extra optics and power electronics.
What limits perovskite commercialization?
Degradation under moisture, oxygen, heat, ultraviolet exposure, and reverse bias, plus light-induced phase segregation in mixed-halide compositions, all on timescales far shorter than silicon’s decades.
Why oversize an array relative to the inverter?
Peak output occurs for few hours annually. Oversizing raises energy captured during partial-sun hours and costs only a small amount of clipped peak output.
Why does solar’s marginal value fall with penetration?
Regional output is highly correlated, so additional capacity generates during hours already well supplied. Value deflation follows from that correlation.
Does Swanson’s law guarantee continued price declines?
No. It relates price to doublings of cumulative production, not to elapsed time, so continued declines depend on deployment continuing to grow at an exponential rate.